

Linux Logging 101: A Deep, Practical Guide for DevOps and SREs
When something breaks in production, dashboards might tell you that something is wrong.

Logs tell you why.
Every real Linux incident eventually leads to logs. SSH failures. Services refusing to start. Instances rebooting without warning. Sudden CPU spikes. Disks filling up overnight. No matter how modern your observability stack is, logs remain the final source of truth.
This long-form guide explains Linux logging the way it actually works in production systems, using a modern Ubuntu 24.04 LTS environment as reference. No academic detours. No unnecessary theory. Just the parts you need when systems are on fire.
Why Linux Logging Still Matters
Metrics answer questions like:
Is CPU high?
Is memory exhausted?
Is latency increasing?
Alerts answer:
- Should I wake up right now?
Logs answer:
What exactly happened
In what order
And why
If you remove logs from your incident response workflow, you are debugging blind.
What Is Logging in Linux?
A log is a timestamped record of events generated by:
The Linux kernel
System services
Daemons
Applications
Logs help answer three core questions during incidents:
1. What happened?
2. When did it happen?
3. What caused it?
Linux centralizes most system activity through logging daemons so operators can reconstruct failures without guessing.
Linux Logging Architecture (How It Actually Works)
At a high level, Linux logging follows this flow:
1. The kernel and services emit log messages
2. A logging daemon collects those messages
3. Logs are stored either in files or memory
4. Administrators query logs using CLI tools
Modern Ubuntu systems use two parallel logging systems:
Traditional file-based logs under
/var/logThe systemd journal, accessed via
journalctl
Both matter. Both are used in real production environments.
Key Log Files in Ubuntu 24.04 LTS
These are the files you will reach for during incidents.
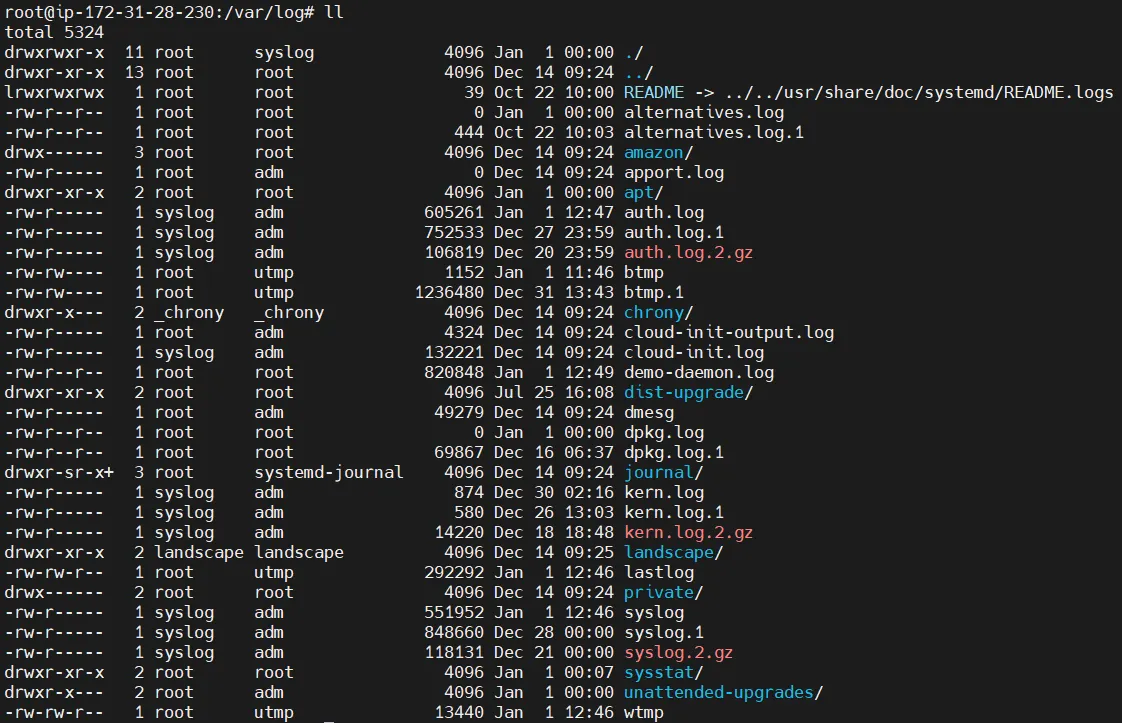
/var/log/syslog
General system activity.
This is usually the first place to look when behavior feels off.
Typical use cases:
Service crashes
Network issues
Disk warnings
/var/log/auth.log
Authentication and authorization events.
Includes:
SSH logins
sudo usage
Failed login attempts
Essential for:
Security investigations
Compliance reviews
Incident forensics
/var/log/kern.log
Kernel-level events.
Includes:
Hardware failures
Driver errors
OOM killer activity
Critical when:
Systems reboot unexpectedly
Performance collapses without explanation
/var/log/dpkg.log
Tracks package installations and upgrades.
Extremely useful when:
Something breaks after
apt upgradeA service stops working post-patch
/var/log/apt/
APT package manager logs.
Helpful for debugging dependency failures or incomplete upgrades.
/var/log/cloud-init.log
One of the most important logs on cloud VMs.
Used to debug:
EC2 boot failures
User-data script issues
Configuration drift during provisioning
Logging Daemons: Who Does What?
systemd-journald
This is the primary log collector on modern Linux systems.
It collects:
Kernel messages
Service logs
Boot logs
stdout/stderr from systemd services
Logs are stored in abinary journal format.
rsyslog
Handles traditional file-based logging.
It:
Reads from journald
Writes logs to
/var/log
Think of journald as the collector and rsyslog as the persistence layer.
Hands-On: Inspecting Logs on a Live System
View system activity in real time
tail -f /var/log/syslog
Useful during:
Service restarts
Configuration changes
Debugging intermittent failures
Inspect authentication logs
less /var/log/auth.log
Filter SSH-related events
grep ssh /var/log/auth.log
This is often enough to diagnose:
Failed SSH connections
Key-based auth issues
Brute-force attempts
journalctl Deep Dive
The systemd journal is extremely powerful once you understand it.
View all logs
journalctl
Follow logs live
journalctl -f
Logs for a specific service
journalctl -u ssh
Logs from the current boot
journalctl -b
Logs from the previous boot
journalctl -b -1
Logs from the last 10 minutes
journalctl --since "10 minutes ago"
In many cases, journalctl is faster and more reliable than grepping files.
Real Production Scenarios
SSH Login Failures
Check:
/var/log/auth.logjournalctl -u ssh
Service Not Starting After Reboot
Check:
journalctl -u <service-name> -b
High CPU from a Restarting Service
Correlate:
journalctlsystemd restart logs
application error output
EC2 Instance Stuck During Boot
Inspect:
/var/log/cloud-init.log
Security Audits
Review:
SSH access
sudo usage
authentication failures
Logs always tell a story if you know where to look.
Log Rotation (Why Your Disk Isn’t Full)
Linux uses log rotation to prevent logs from consuming disk space.
What happens:
Old logs are rotated
Logs are compressed
Files are eventually deleted
Configuration lives under:
/etc/logrotate.d/
Never disable log rotation in production.
Disk-full incidents caused by logs are entirely avoidable.
Common Linux Logging Mistakes
Only checking application logs
Ignoring timestamps and time zones
Forgetting that journal logs reset after reboot (unless persistent)
Grepping without context
Not correlating logs with deployments or changes
These mistakes cost hours during outages.
Logs vs Metrics vs Alerts……
Read my complete Blog at,
https://www.hexplain.space/blog/q8nzfLHaR9UC9pdF7yR9


